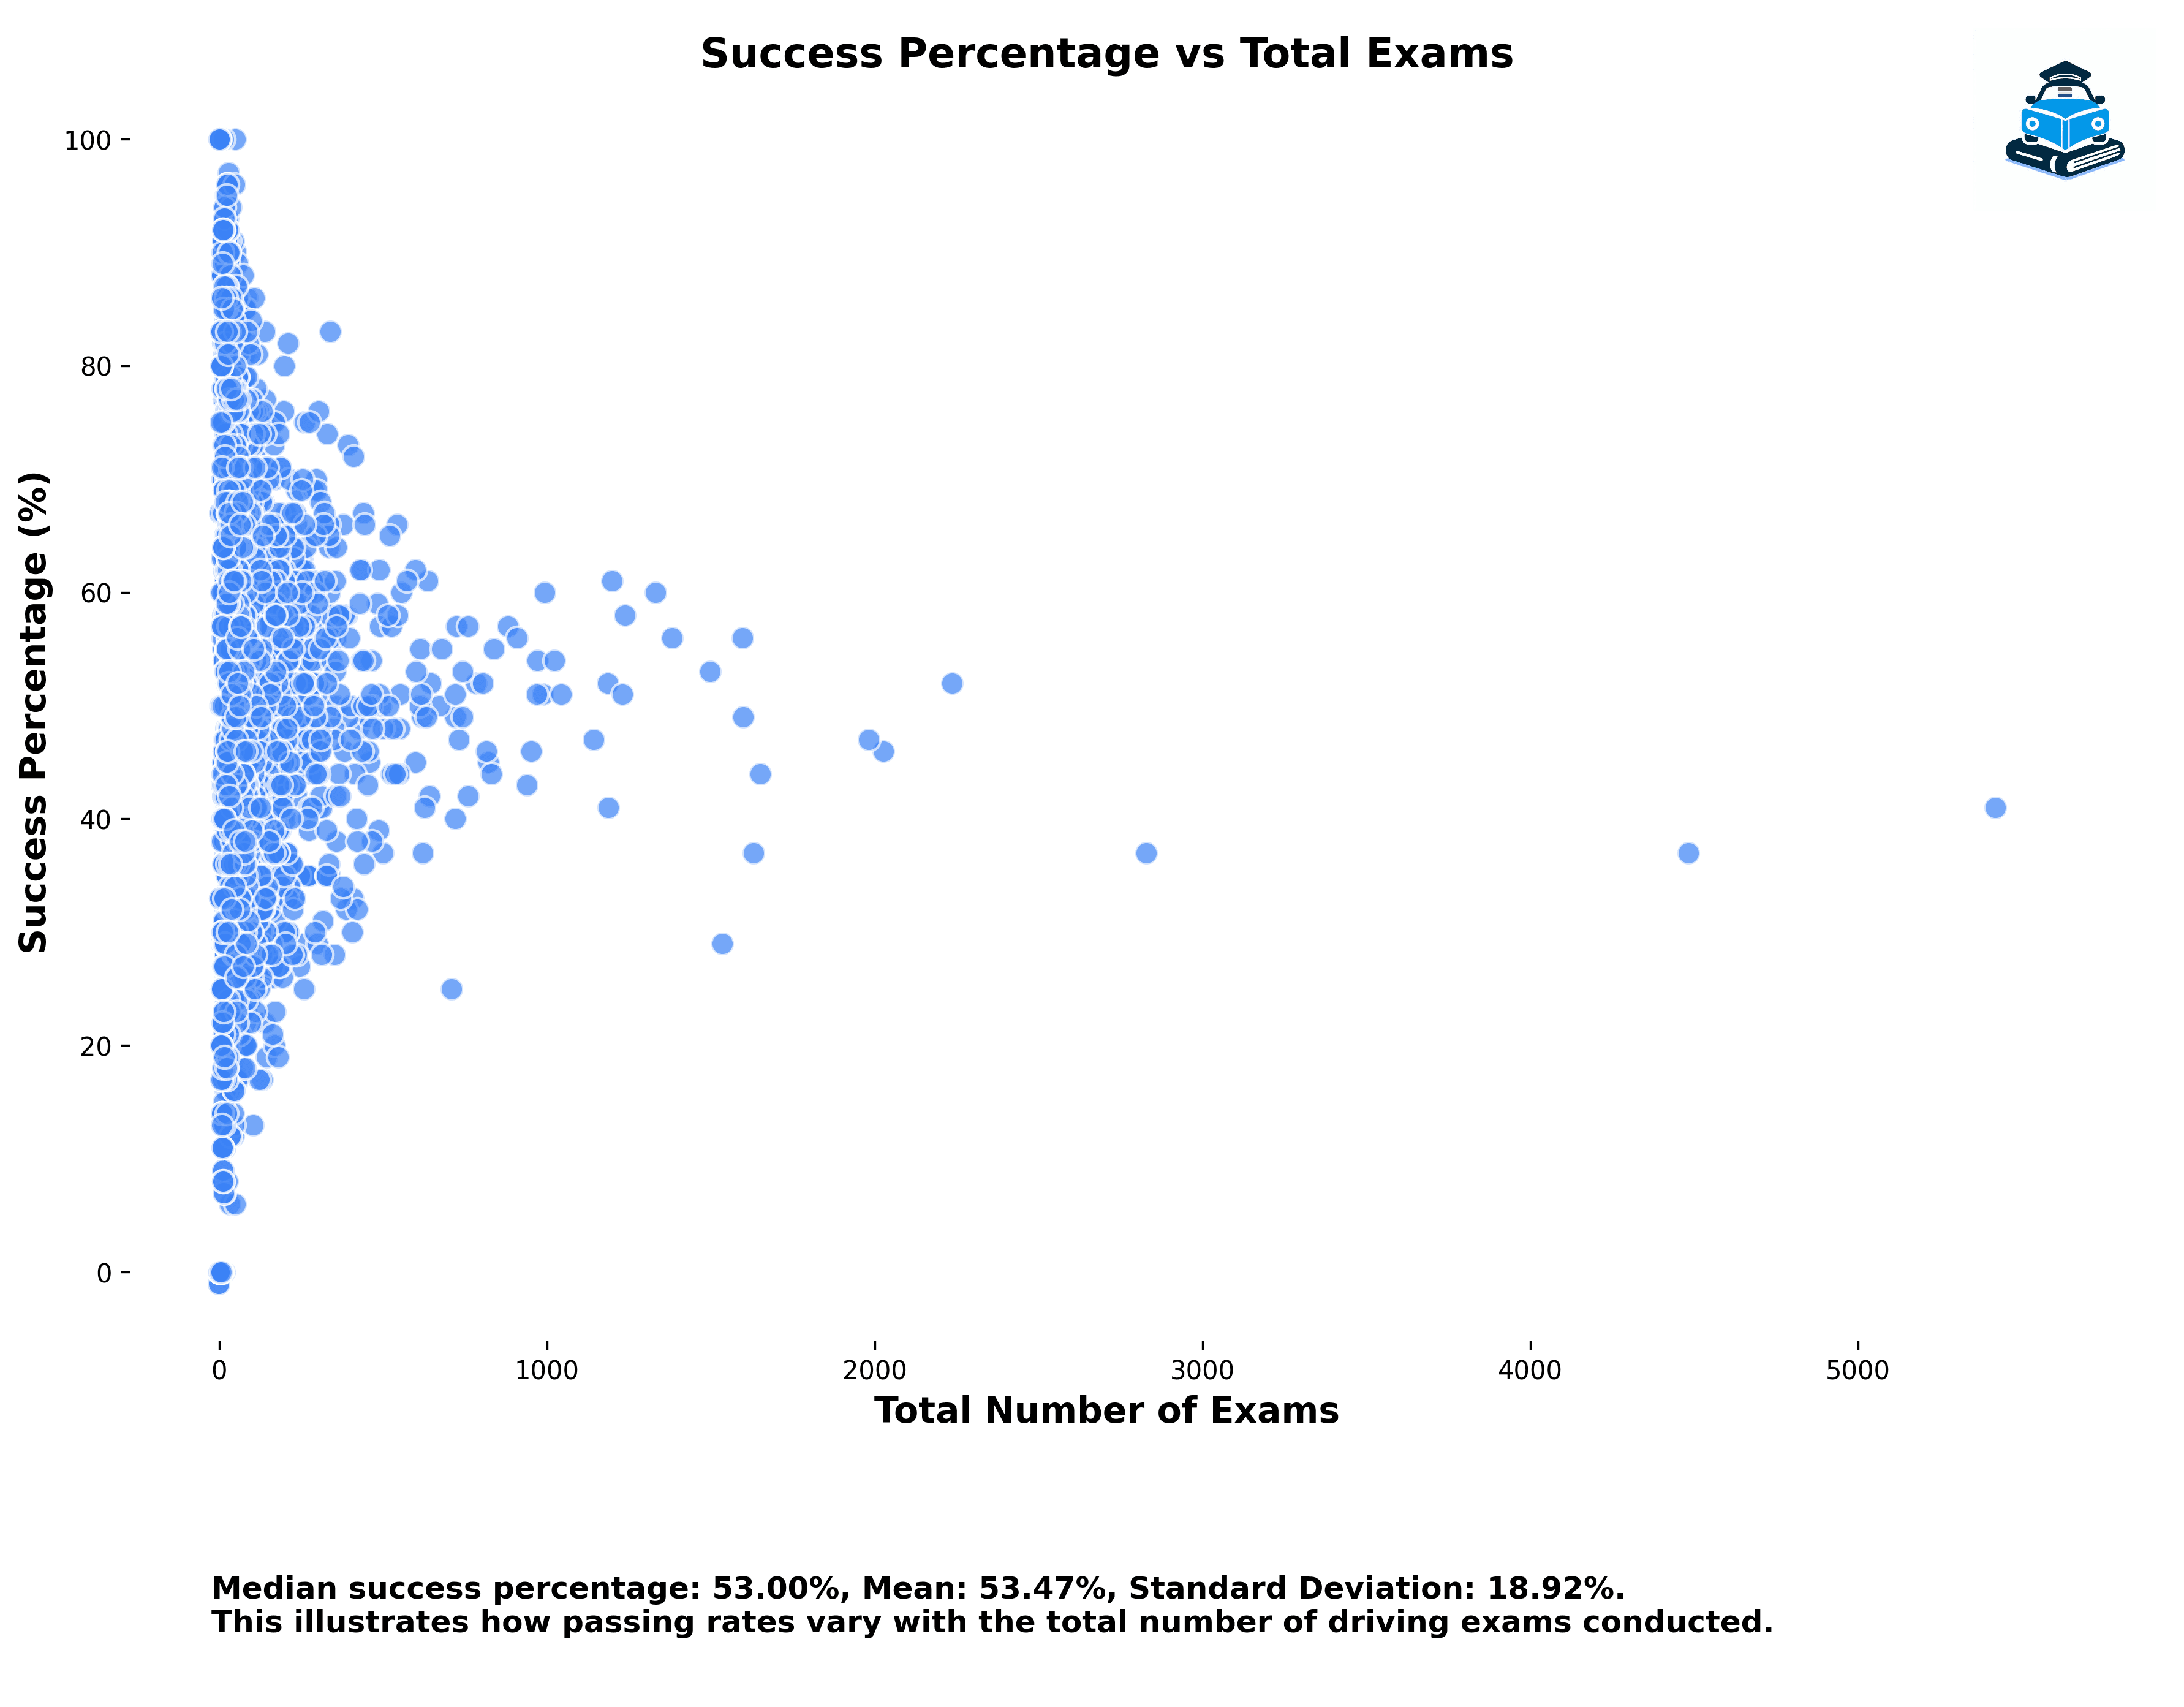
This analysis investigates whether there is a link between a driving school's pass rate and the number of exams it conducts. The scatter plot reveals a wide dispersion in success percentages among schools with fewer exams, indicating significant variability in performance at smaller schools. Conversely, larger schools—those conducting over 1,000 exams, tend to cluster around the national average, suggesting more consistent outcomes. These metrics show that while the average performance across schools is fairly balanced, many smaller schools either significantly overperform or underperform. This may reflect differences in student demographics, teaching quality, or even exam-taking strategies. For prospective students comparing driving schools, this chart suggests that volume alone is not a strong predictor of quality, but it may indicate more stable and predictable outcomes.
Relationship Between Success Rate and Exams Taken
Explore more driving school analytics
Dive deeper into pass rates, exam center differences, and the wider Dutch driving school landscape with more DriveDutch research reports.
Browse all analytics reports