License Pass Report · Category B / B-FA
Normal vs Faalangst Exams – Who Passes More Often? (2024–2025)
Time horizon: 2024–2025
Published: November 15, 2025
Average pass rate
48.7%
Faalangst Average pass rate
53.6%
Analyst note
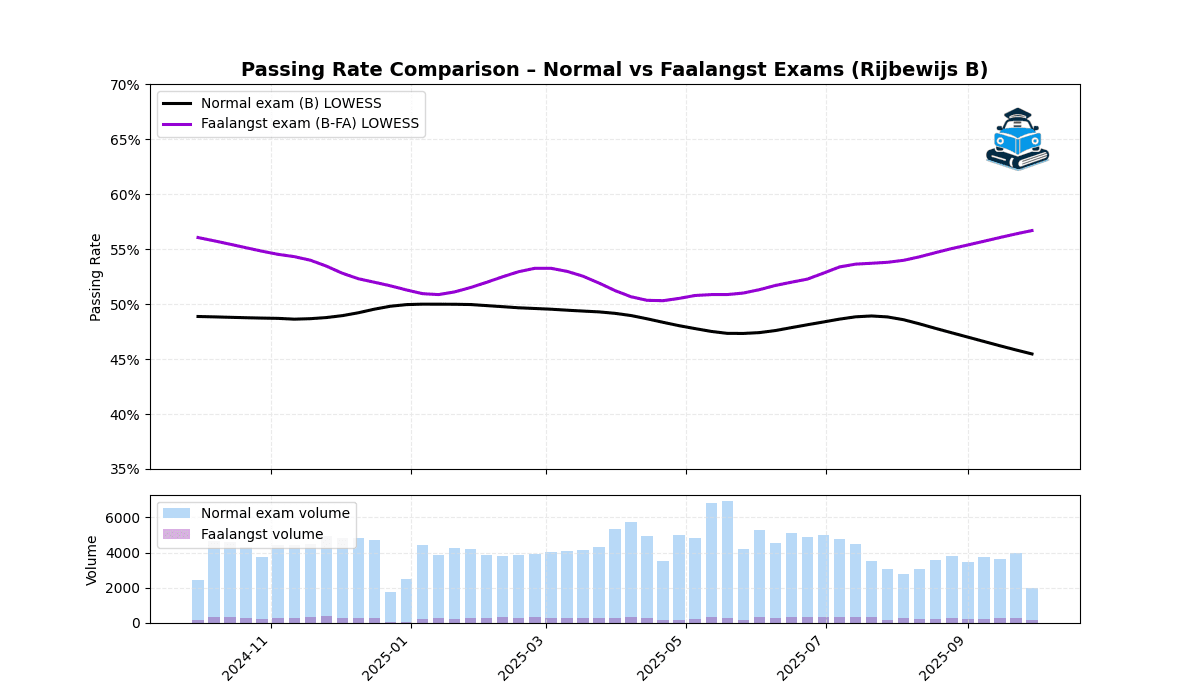
Throughout 2024–2025, faalangst (B-FA) exams show consistently higher pass rates than normal B exams, with an average of 53.6% vs 48.7%. A LOWESS trendline reveals a widening gap towards the end of the period, where faalangst pass rates exceed normal exam pass rates by 7–10 percentage points, especially in late summer and early autumn.
Normal vs Faalangst Exams
Smoothed Passing Rate Trends for Rijbewijs B (2024–2025)
This report compares normal practical exams (B) with the faalangst exam (B-FA) – a special exam type designed for candidates with driving test anxiety. Using weekly data from October 2024 to September 2025, we apply a LOWESS smoothing curve to show the underlying trend in pass rates for both exam types.
1. A quick note on LOWESS
LOWESS (Locally Weighted Scatterplot Smoothing) is a simple way to draw a smooth curve through noisy weekly data:
Each point in time is fitted using nearby weeks, not the entire year at once. This removes week-to-week “noise” and reveals the overall shape of the pass-rate pattern.
On the chart:
- The black line is the smoothed pass rate for the normal B exam.
- The purple line is the smoothed pass rate for the faalangst B-FA exam.
You don’t need to know the math; just read the lines as “the general trend” of each exam type over the year.
2. Overall difference in success rates
Normal exam (B)
- Average pass rate: 48.67%
- Standard deviation: 1.72 percentage points
- Range: 45.64% → 52.95%
- Total exams: 223,363
- Average per week: ~4,214 exams
The normal exam line is fairly flat and stable, mostly between 47–50%. This reflects a large, steady stream of candidates and a very consistent assessment standard.
Faalangst exam (B-FA)
- Average pass rate: 53.55%
- Standard deviation: 3.65 percentage points
- Range: 46.71% → 66.67%
- Total exams: 14,463
- Average per week: ~273 exams
The faalangst exam has a clearly higher average pass rate than the normal exam, but also more variation from week to week. Because volumes are much smaller, percentages can move more sharply.
Headline insight
On average, faalangst candidates pass about 5 percentage points more often than normal exam candidates.
3. Seasonality and how the curves move over the year
Early period (late 2024)
- The purple faalangst line starts above the black normal line, with pass rates around 55–57%.
- The black normal line sits just below 50% and barely moves.
- Both exam types drift slightly downwards into winter, but faalangst stays clearly higher.
Winter and early spring
- Around January–March, faalangst pass rates dip, briefly coming closer to normal exams.
- Normal exams hover just under 50%, while faalangst passes move into the low 50s.
- Seasonality (holidays, weather, and student schedules) seems to affect both, but faalangst still maintains an edge.
Late spring and early summer
- The normal exam trend remains very stable, slightly below 49–50%.
- Faalangst pass rates fluctuate more: they dip around early spring and then start climbing again as we move into summer.
- This is where we start to see the gap between the two lines widening again.
Late summer and early autumn – the big divergence
Towards the end of the period (roughly July–September):
- The faalangst line rises steadily, reaching 55–57%.
- The normal exam line actually declines slightly, towards 46–47%.
- The gap between faalangst and normal exams grows to 7–10 percentage points.
This is a striking divergence: at the same time of year, faalangst candidates are clearly more likely to pass than normal-exam candidates.
4. Is there an “optimal time” to take the faalangst exam?
Looking at the LOWESS trends:
- Faalangst pass rates are consistently higher than normal exams throughout the year.
- The advantage is most pronounced in late summer and early autumn, where the purple line clearly pulls away from the black line.
For anxiety-focused candidates considering the B-FA route, this suggests that:
Late summer and early autumn may be an especially favourable period to take a faalangst exam, with higher-than-average success rates.
However, there are two important caveats:
- Smaller sample size: B-FA exams are much fewer in number (about one B-FA exam for every 15 normal exams). That means the curve can move more dramatically from week to week.
- Readiness still matters most: Booking a “statistically good” week won’t help much if the candidate does not feel prepared. The seasonal effect is interesting, but individual preparation and good instruction remain the dominant factors.
5. Why are faalangst pass rates higher?
The data alone doesn’t prove why, but there are plausible explanations:
- Longer exam time and calmer environment may allow anxious candidates to demonstrate what they actually know.
- Instructors often only recommend B-FA for specific students, who receive targeted preparation.
- Self-selection effect: students who choose B-FA may be more motivated to address their weaknesses before booking.
Whatever the reason, the numbers are clear: B-FA exams give anxious candidates a genuine chance to perform at or above the level of standard exams.
6. Why this matters – Practical insights for stakeholders
For students
- If you struggle with strong test anxiety, the faalangst exam is not just a more comfortable option – it is also associated with higher pass rates.
- Don’t feel “worse” for choosing B-FA; the data suggests it can be a smart, effective path.
- If possible, scheduling your B-FA exam in late summer or early autumn could tilt the odds a little more in your favour, while still making sure you are personally ready.
For driving schools
- The consistently higher B-FA pass rates mean schools should take exam anxiety seriously and consider actively recommending B-FA where appropriate.
- Structured lesson plans that identify anxiety early, and then guide students towards B or B-FA accordingly, can improve both student outcomes and school reputation.
- Understanding that B-FA volumes are much lower, but success rates higher, can help schools optimise their capacity planning and marketing for anxious learners.
For CBR and policymakers
- The higher and rising B-FA pass rates, especially in later months, show that specialised exam formats can be effective.
- Maintaining and potentially expanding anxiety-sensitive options likely supports road safety, because candidates who would otherwise freeze under pressure are given a fairer assessment.
- Continued monitoring of seasonal patterns can help CBR manage examiner capacity and ensure consistent exam quality across both normal and B-FA routes.
Final takeaway
The LOWESS curves tell a clear story:
- Normal exam pass rates are stable and around 49%.
- Faalangst exam pass rates are higher, more dynamic, and especially strong in late summer and early autumn.
For candidates, schools, and policymakers alike, this reinforces the idea that exam format and psychological support matter – and that the B-FA exam is more than a label: it’s a measurably effective tool for helping anxious drivers earn their license safely and confidently.
Source: https://www.cbr.nl/nl/service/nl/artikel/1-oktober-2024-tm-30-september-2025