License Pass Report · Category B
Seasonality in CBR Pass Rates for License B (Oct 2024 – Sep 2025)
Time horizon: 2024–2025
Published: November 15, 2025
Average pass rate
48.7%
Analyst note
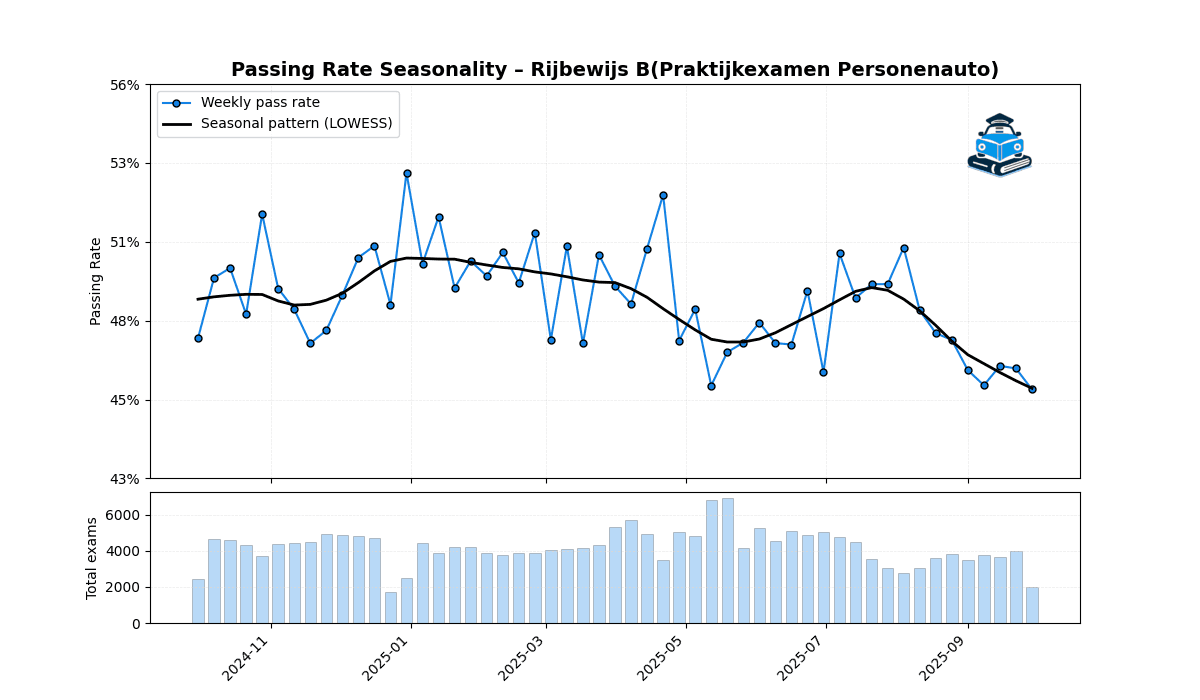
Weekly CBR pass rates for license B between 30 September 2024 and 29 September 2025 are very stable around 48.7%, with a narrow range from about 45.6% to 53.0%. Seasonal patterns are much more visible in exam volume than in pass probability, with spring and early summer being the busiest periods.
In this report we analyse weekly CBR pass rates for the standard category B practical exam (personenauto) in the Netherlands over one full year, from week 2024/40 (week starting 30 September 2024) to week 2025/40 (week starting 29 September 2025). The underlying dataset and the scatterplot used in this analysis are based on the official CBR publication for the period 1 October 2024 to 30 September 2025.
1. Data
The dataset consists of 53 weekly observations of the pass rate for the normal B practical exam (Productcode "B"). For each week we compute:
- Pass rate = number of passed B exams / total B exams that week
- Exam volume = total number of B exams administered that week
2. Descriptive statistics for pass rates
For the full set of 53 weeks, the pass rate distribution is:
- Mean (average): 48.67%
- Standard deviation: 1.72 percentage points
- Minimum: 45.64%
- Median (Q2): 48.72%
- Maximum: 52.95%
In other words, half of all weeks have a pass rate between 47.29% and 49.98%, and even the most extreme weeks are only about 3 percentage points below or 4 percentage points above the mean.
On the scatterplot, this shows up as a dense band of points around the 49% line, with only modest week-to-week variation. Any smoothing line (e.g. LOWESS) across the scatter remains quite flat over the year, suggesting no strong seasonal trend in pass probability itself.
Usefulness for our questions:
These statistics are very informative for the question “What time of the year should you get your license?” in terms of pass chances. Because the dispersion is so small, the data indicate that CBR B exams are calibrated quite consistently throughout the year. There is no clear ‘magic month’ where passing is dramatically easier or harder; differences of 3–4 percentage points are modest compared with the importance of individual preparation, driving school quality, and exam centre choice. Albeit taking your exam in september after the summer break seems slighlty more difficult according to the data.
3. Exam volume: how many exams are taken?
While pass rates are stable, exam volumes show much stronger variation.
3.1 Annual volume and weekly distribution
For the standard B practical exam, the dataset reports:
- Total exams (53 weeks): 223,363
- Average per week: 4,214 exams
- Median per week: 4,231 exams
- Standard deviation: ≈ 984 exams
- Minimum weekly volume: 1,740 exams (week 2024/52, starting 2024-12-23)
- Maximum weekly volume: 6,936 exams (week 2025/21, starting 2025-05-19)
This implies that in a typical 12-month period, around 220,000–230,000 category B practical exams are conducted, just for the standard (non-re-take) exam type.
3.2 Busiest and quietest weeks
Top 5 quietest weeks (lowest volume):
- 2024/52 (2024-12-23): 1,740 exams
- 2025/40 (2025-09-29): 1,996 exams
- 2024/40 (2024-09-30): 2,436 exams
- 2025/01 (2024-12-30): 2,476 exams
- 2025/32 (2025-08-04): 2,794 exams
Top 5 busiest weeks (highest volume):
- 2025/21 (2025-05-19): 6,936 exams
- 2025/20 (2025-05-12): 6,814 exams
- 2025/15 (2025-04-07): 5,733 exams
- 2025/14 (2025-03-31): 5,325 exams
- 2025/23 (2025-06-02): 5,280 exams
This pattern reveals clear seasonality in exam demand:
- Late May and early June are peak periods, with volumes more than three times higher than the quietest weeks.
- Christmas and New Year weeks are the quietest (weeks 2024/52 and 2025/01).
- There is also a visible dip in early August, likely reflecting the summer holiday period.
Usefulness for our questions:
These volume statistics directly address “How many driving exams are taken each year?” and are also crucial for thinking about waiting times and booking pressure. High volumes indicate periods when exam slots are in great demand, which can translate into longer booking horizons or more competition for preferred dates and times.
4. So: when is the best time of the year to take your exam?
From a pass rate perspective, the data suggest:
- Weekly pass probabilities are remarkably stable around 48–49%.
- The gap between the “best” and “worst” weeks in the sample is less than 7 percentage points.
- Quartiles (47.29%–49.98%) show that most weeks are very similar.
This means that, statistically, choosing a particular month in this 2024–2025 period does not dramatically change your odds of passing. For a typical candidate, preparation quality, driving school guidance, and exam centre choice are likely much more important than the calendar week.
From a planning and logistics perspective, however, timing does matter:
- If you want maximum availability and potentially shorter waiting lists, the quieter weeks (late December/early January, very early autumn, and parts of August) are attractive.
- If you prefer to align your exam with your study or work schedule, be aware that spring and early summer are extremely busy (April–June). You may need to book further in advance and be flexible with dates and times.
In short:
- Pass chances: fairly constant throughout the year.
- Booking conditions: strongly seasonal, with spring/early summer peaks and holiday dips.
5. Implications for driving schools and data-driven planning
For driving schools, these findings support a data-driven approach to capacity planning:
- Because pass rates are stable, schools can treat the exam difficulty as roughly constant over the year.
- Strong seasonality in exam volumes means schools must scale lesson capacity and booking support in line with demand spikes, especially in April–June.
- Combining this dataset with school-level booking data would allow more granular insights into conversion rates, cancellation patterns, and optimal scheduling for both learners and instructors.
For research topics such as “Netherlands seasonality in driver exam passing rates” or “driving schools data analysis”, this dataset is particularly valuable:
- It shows that seasonality mainly affects volume, not success probability, suggesting that behavioural and institutional factors (holidays, school calendars, weather preferences) drive exam timing, while CBR maintains a consistent assessment standard.
Summary
- Around 223,000 standard B practical exams were held in this 53-week period, averaging about 4,214 exams per week.
- The national pass rate is highly stable at roughly 48.7%, with limited week-to-week variation.
- Seasonality is strong in volume, not in pass probability: spring and early summer are very busy; Christmas/New Year and parts of August are quiet.
- For an individual learner, the data suggest you should choose a time that fits your training progress and availability, rather than trying to “game the calendar” for a higher pass chance.
- For driving schools and policymakers, this reinforces the importance of capacity management around peak periods, while recognising that the assessment standard remains stable across the year.
Source: https://www.cbr.nl/nl/service/nl/artikel/1-oktober-2024-tm-30-september-2025